Twitter Trends Map - Data Visualisation Project
For this project I was given several weeks to prototype, in processing, an interesting example of data visualization. I chose to create a map, that would allow the showing of currently trending, on Twitter, country based hashtags.
Trending data was pulled from Twitter using the Twitter API. Unfortunately Twitter's API was extremely limited in terms of the number of "trending" calls that could be made every few minutes. After a few clicks on the map, no additional data would be presented. To get around this I wrote code to cache the trending results by country and pulled the information over a single day and then used the XML sheet to pull from during program use.
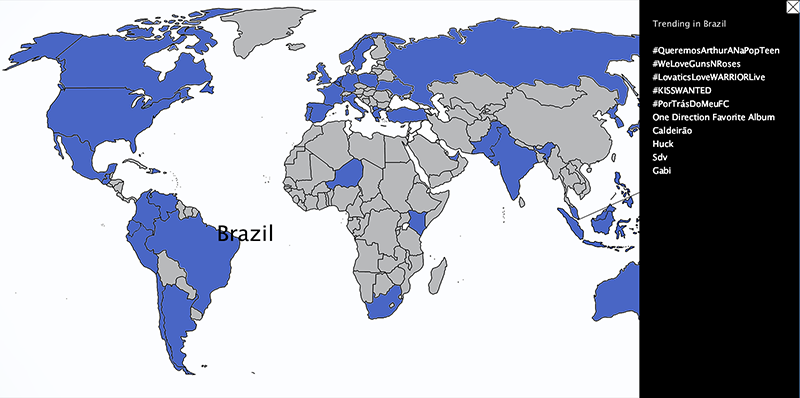 After clicking on "Brazil," Twitter is polled via API and Brazil's top currently trending hashtags are displayed.